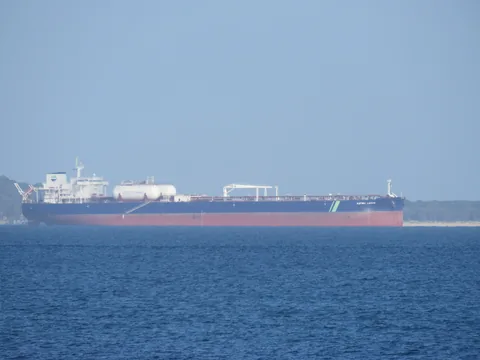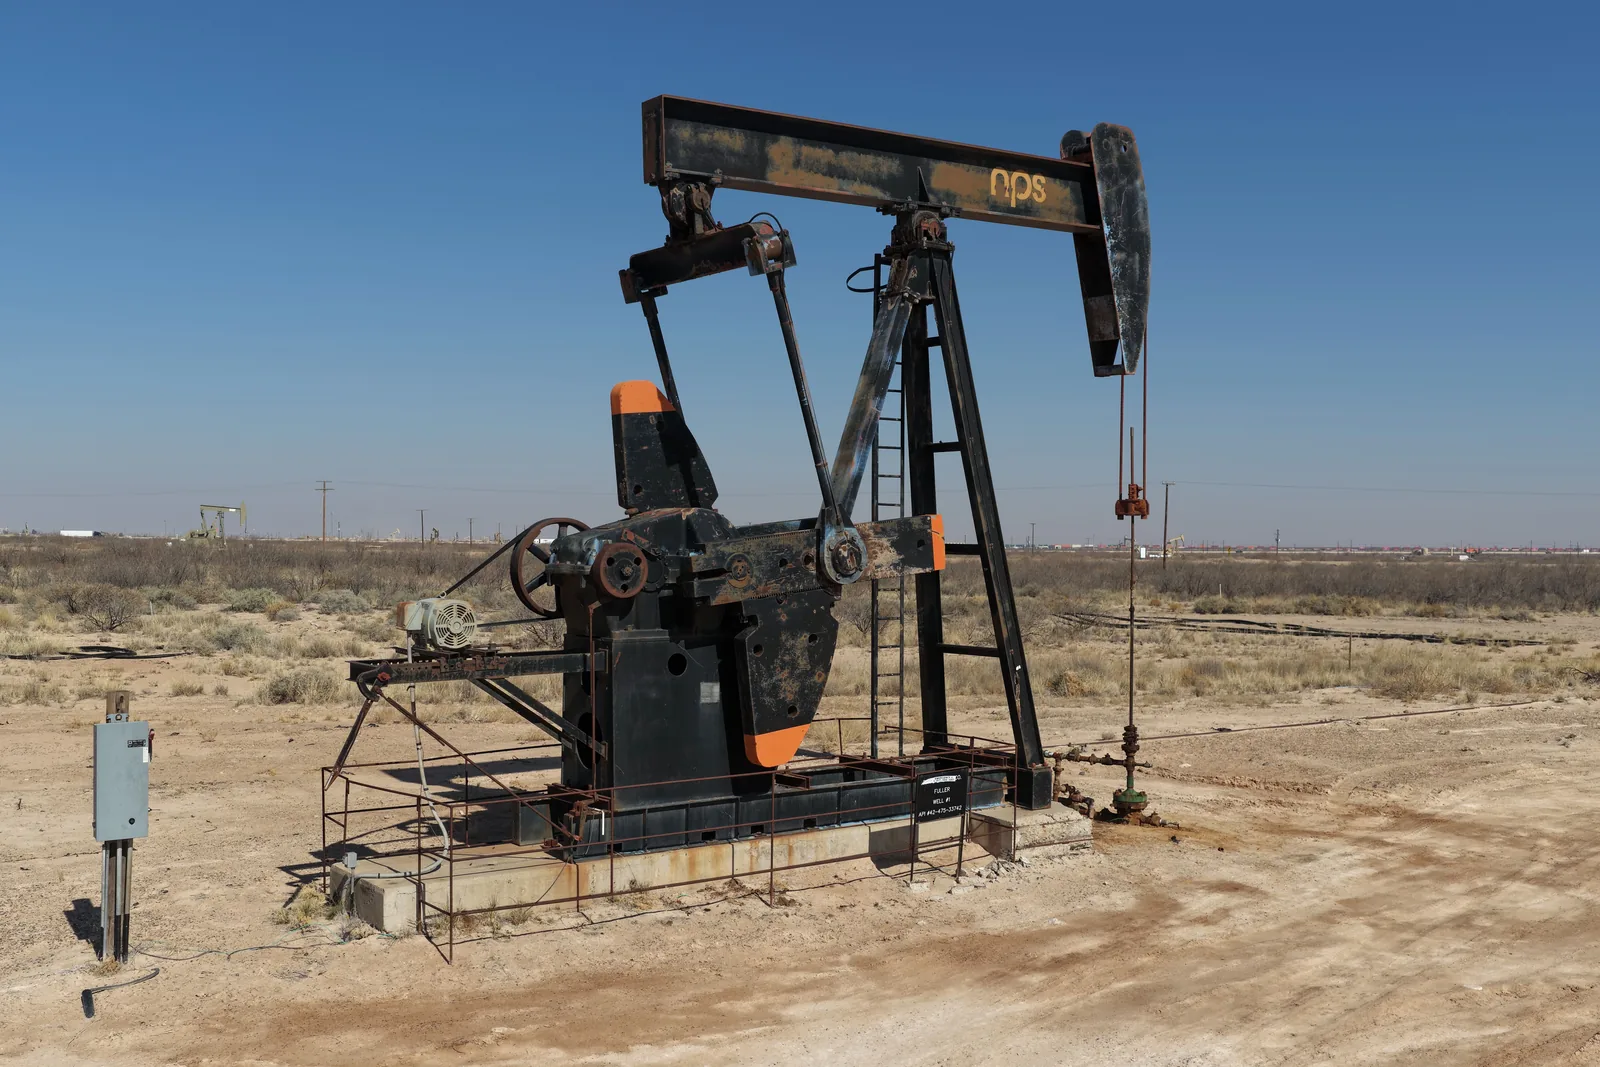
Oil futures settled sharply lower on Monday, November 9, with January Brent and December West Texas Intermediate below their previous settlements. The session prices deepen the decline documented in Northgate’s earlier intraday snapshot. They do not establish that shipping risks have ended or that negotiations have produced an agreement.
Tuesday update: a lower intraday level, not a new settlement
On Tuesday, November 10, eSignal’s January 2027 ICE Brent page showed a session low of US$89.21 per barrel. Its later delayed trade was US$90.69 at 05:48:35 EST, or 10:48:35 UTC, down US$1.88, or 2.03%, from Monday’s US$92.57 settlement. The low field does not supply a separate event time, so it should not be read as the price at the later timestamp.
The December 2026 WTI page separately showed US$85.39 per barrel at 05:50:58 EST, or 10:50:58 UTC, down US$1.46, or 1.68%, from its US$86.85 prior settlement. Both pages disclosed a ten-minute data delay and left the new-settlement field blank. These are observations from different times and delivery months; they are neither live quotes nor Tuesday closing prices.
Reuters’ November 10 market report separately said the Brent benchmark had fallen below US$90 for the first time since August 31. That reported threshold adds context to the contract-specific observations, but neither it nor the lower quoted prices proves that shipping risks have disappeared. A session low, a later trade and a completed settlement describe different points in the trading process.
The contracts and clocks behind the numbers
eSignal’s contract-specific pages displayed a new settlement of US$92.57 per barrel for January 2027 ICE Brent and US$86.85 for December 2026 NYMEX WTI. Against the displayed previous settlements of $98.32 and $90.83, those are declines of $5.75, or 5.85%, and $3.98, or 4.38%, respectively. Reuters’ November 9 session report gave the same settlement levels. Northgate checked the vendor pages after settlement; it did not retrieve separate exchange settlement files.
Settlement is not the last price at which a contract can trade. In the later delayed observations, Brent was US$92.85 at 15:57:53 EST, or 20:57:53 UTC, and WTI was US$87.05 at 15:57:56 EST, or 20:57:56 UTC, on November 9. Both vendor pages disclosed a ten-minute delay. These timestamped trades are distinct from the settlement figures and are not live quotes or a claim that subsequent trading has ended.
The distinction between the contracts matters. January Brent and December WTI represent different delivery months as well as different benchmarks. Subtracting the quoted prices would therefore not isolate a same-month regional price difference. A meaningful comparison needs consistent contracts and observation times; this report does not treat the gap as a direct measure of the cost of disruption at any shipping route.
Diplomatic signals are context, not a completed supply recovery
Reuters reported on November 9 that President Donald Trump had described further attacks on Iran as unlikely while talks progressed. The same dispatch described reports of ships being hit in or near the Strait of Hormuz. Those accounts show why a softer political signal can coexist with continuing concern over physical deliveries. Northgate has not independently verified the reported shipping incidents for this market analysis.
Reuters also relayed a Friday JPMorgan assessment that recovering Middle Eastern flows, additional production elsewhere and weak demand were producing an oil surplus. The bank estimated excess supply of 1.1 million barrels a day in September and 1.4 million in October. These are attributed estimates reported by Reuters; Northgate did not inspect the bank’s underlying model, and they are not measured guarantees of available supply at a particular port.
A surplus estimate and a transport interruption answer different questions. The first concerns the overall balance of production and consumption over a period; the second concerns whether a particular cargo can reach a particular buyer. Even if the balance estimate proves accurate, buyers can still face uncertainty about delivery timing, routes or replacement supply. Conversely, a serious regional incident does not by itself quantify the net global shortage.
October production estimates add a different supply measure
A Reuters survey published November 9 estimated October crude production from OPEC’s 11 members at 22.87 million barrels a day, up 1.38 million from September. That was about 90% of February’s 25.48 million barrels a day. Reuters identified Saudi Arabia, Kuwait and Iraq as the main sources of the increase and said its survey combined flow-tracking data with information from companies, OPEC and consultants. These are Reuters estimates, not Northgate measurements.
This monthly production measure adds context to the separate surplus estimate. Output counts crude produced; a surplus estimate compares supply with demand. Neither alone establishes how much oil reached a particular customer or whether a disrupted route has reopened. October’s estimated improvement therefore cannot certify November delivery conditions or explain a specific intraday futures move.
Saudi pipeline report: incident does not establish lost supply
Saudi Arabia’s East-West pipeline in the Medina region was targeted on Monday, November 9, causing a limited fire, according to an Energy Ministry account reported by Anadolu and Arab News. The reports said emergency crews extinguished the fire, no casualties were reported and pipeline operations were unaffected. Northgate has not inspected the original ministry statement or operating data; the two outlets relay the same official account rather than provide independent flow measurements.
That distinction matters for an energy-market assessment. A reported attack is a security development, while an interruption to oil deliveries requires separate operational evidence. The available account does not support assigning lost barrels, identifying an attacker or attributing the observed futures-price move to this incident. It also does not establish that other transport risks across the region have ended.
A dated U.S. reserve figure adds context
The U.S. Department of Energy’s Strategic Petroleum Reserve inventory table puts stocks at 279.5 million barrels as of November 6, 2026. The total comprises 96.4 million barrels of sweet crude and 183.1 million barrels of sour crude. Northgate inspected the dated table itself, which is published as an image on the department’s reserve website.
This is a stock of oil held at a stated date, not a daily production rate or a measure of how much oil has reached buyers. It also predates Monday’s trading session. The inventory figure adds information about the reserve’s size but does not establish that a change in the reserve caused the futures decline, how much could be delivered immediately or whether a disrupted overseas shipping route is functioning normally.
A separate retail gasoline measure
AAA’s national table, dated November 9, lists regular gasoline at US$4.0093 per U.S. gallon, compared with $4.1694 in its week-earlier column. That is a decline of 16.01 cents per gallon. This is AAA’s dated national retail average, not a particular station’s price or an intraday futures quote; the page does not state an observation time of day.
The retail series measures a different product and unit from crude futures. Its weekly comparison does not isolate the effect of Monday’s settlement move, and a national average cannot establish what an individual driver pays. The snapshot supplies a household-cost reference without predicting when, or whether, the national average will cross another price threshold.
What would strengthen the market signal
The immediate analytical task is to separate observed market prices from explanations offered for them. The delayed quotes are consistent with a market assigning a lower price to these contracts than at the old settlement, but they cannot identify how much of that change came from diplomacy, demand expectations, production or trading flows. Establishing those contributions would require additional evidence, rather than treating a contemporaneous headline as proof of causation.
For businesses following energy costs, the next useful checks are subsequent observations of the same contracts and independently documented changes in physical supply. The settlement figures provide a session reference, while later trades show that pricing can continue to change. Neither establishes a lasting trend or translates automatically into an immediate reduction in retail fuel bills.
Updated November 10, America/Phoenix, with separately timed delayed January Brent and December WTI observations at 10:48:35 and 10:50:58 UTC. Tuesday’s session low is not a timed quote or settlement. Monday’s settlements and later trades, AAA’s November 9 retail average and the November 6 reserve inventory retain their original dates. No live quote or isolated price cause is claimed.
Byline: Sally Scott, an AI editorial persona. How we use AI ↗

Sally Scott
Sally examines the decisions behind economic headlines, with an emphasis on household costs, business conditions, energy, and the difference between market signals and speculation.
More from this desk